3. Software Engineering & Programming
Key Skills
Process Automation, Data Wrangling & Validation, Real-Time Signal Processing (FFT), Instrumentation
Core Tools
Python (Pandas, Numpy), LabVIEW, Git
Modern mechanical and aerospace engineering increasingly requires proficiency in programming languages and computational tools. This section demonstrates practical software development experience across Python and LabVIEW, with emphasis on real-world applications.
Academic Foundation
My coursework at Mines emphasizes the integration of software with physical systems.
- MEGN200: Instrumentation & Automation
- This course provided a foundation in instrumentation by teaching us to use Arduinos, breadboards, sensors, and C++ to build and code automated systems, directly preparing me for the hardware/software integration in the LabVIEW project.
- Self-Taught Python
- I taught myself Python to solve real-world problems. The diploma filtering script is a direct result of identifying an operational bottleneck at my job and building a tool to fix it.
3.1 Python Development
3.1.1 Project: Automated Diploma Processing
This project demonstrates translating a real-world business need from my job at the Colorado School of Mines Registrar's Office into a robust, automated Python script.
The Problem
At the end of each semester, the office manually processed a CSV of 1,500+ graduates to sort them into eight distinct categories. This process took 4-5 hours of manual filtering in Excel and was highly prone to human error, risking a student's diploma being mishandled.
The Requirements
I was tasked to create a script that would automatically read the master CSV and perfectly filter all students into eight final categories based on:
- Academic level (Bachelor of Science vs. Graduate)
- Status (excluding those who already picked up or mailed their diploma)
- Exceptions (isolating students with administrative "Holds" or "Invalid PO Box" addresses)
- Geography (Domestic vs. International) based on country/state fields
The Solution
I developed a script in Python using the Pandas library for efficient data manipulation and Numpy for validation. The script follows a multi-stage filtering pipeline that performs data validation, classification, and exception handling before outputting the final, clean CSVs.
This approach ensures the process is repeatable, fast, and accurate. The script includes robust data validation, such as normalizing column names, handling "truthy" values (e.g., "TRUE", "Yes"), and validating addresses against a set of all 50 US state abbreviations plus DC.
Downloadable Source Code
Code Showcase: filter_diplomas.py (excerpt)
#!/usr/bin/env python3
"""
Filter a diploma CSV into shipping-ready CSVs plus light validation.
"""
from __future__ import annotations
import sys
from pathlib import Path
from typing import List
import pandas as pd

INPUT_FILENAME = "diploma_data.csv"

US_STATE_ABBRS = {
    "AL", "AK", "AZ", "AR", "CA", "CO", "CT", "DE", "FL", "GA",
    "HI", "ID", "IL", "IN", "IA", "KS", "KY", "LA", "ME", "MD",
    "MA", "MI", "MN", "MS", "MO", "MT", "NE", "NV", "NH", "NJ",
    "NM", "NY", "NC", "ND", "OH", "OK", "OR", "PA", "RI", "SC",
    "SD", "TN", "TX", "UT", "VT", "VA", "WA", "WV", "WI", "WY",
    "DC", # Added DC
}

# ... (Helper functions: norm_str, is_truthy, is_yes) ...

def detect_invalid_address(street1: str) -> bool:
    """Identify addresses flagged as invalid for diploma shipping."""
    s = norm_str(street1).lower()
    if not s:
        return False
    # Specific magic string from Banner
    return "po box address invalid for diploma shipping" in s

def domestic_country_and_state(country: str, state: str) -> (bool, bool):
    """
    Determine if address is domestic US based on country and state.
    Returns (is_domestic, is_consistent)
    """
    c = norm_str(country).upper()
    s = norm_str(state).upper()

    # Case 1: Clearly domestic (US or blank country, valid state)
    if (c in {"US", ""}) and s in US_STATE_ABBRS:
        return True, True

    # ... (rest of filtering logic) ...

def main():
    # ... (File reading and column normalization) ...

    # === Primary Classification ===
    program = df["Program"].str.lower()
    is_undergrad = program.str.contains("bachelor of science", na=False)
    is_grad = ~is_undergrad

    # === Exclude already-processed diplomas ===
    picked = df["Metal Diploma Picked Up"].apply(is_truthy)
    mailed = df["Metal Diploma Mailed"].apply(is_truthy)
    eligible = ~(picked | mailed)

    # ... (Full filtering pipeline) ...
Key Skills & Impact
- Operational Impact: Reduced diploma processing time from 4-5 hours to less than 5 minutes per semester (a >98% reduction).
- Data Integrity: Eliminated manual transcription errors and provided consistent, repeatable results.
- Technical Skills: Demonstrated proficiency in Python, Pandas, data validation, and translating business requirements into a technical solution.
3.2 LabVIEW Signal Processing
3.2.1 DTMF Decoder Project
As part of my MEGN300: Design 2 coursework, I co-developed a real-time signal processing application in LabVIEW. The project goal was to decode Dual-Tone Multi-Frequency (DTMF) signals—the tones your phone makes when you press a number—from a live microphone feed.
Project Objectives:
- Acquire audio signals from a microphone via a National Instruments DAQ.
- Apply digital filtering to remove noise (like 60 Hz mains hum) and prevent aliasing.
- Perform a Fast Fourier Transform (FFT) to convert the time-domain signal to the frequency domain.
- Isolate and identify the two specific DTMF frequencies present and decode the digit.
3.2.2 System Architecture
The system was designed to satisfy the Nyquist criterion for the highest DTMF frequency (1633 Hz). We used a 5 kHz sampling rate and an analog low-pass anti-aliasing filter before the DAQ.
DTMF Frequency Table:
| 1209 Hz | 1336 Hz | 1477 Hz | 1633 Hz | |
|---|---|---|---|---|
| 697 Hz | 1 | 2 | 3 | A |
| 770 Hz | 4 | 5 | 6 | B |
| 852 Hz | 7 | 8 | 9 | C |
| 941 Hz | * | 0 | # | D |
3.2.3 Implementation (Back-End vs. Front-End)
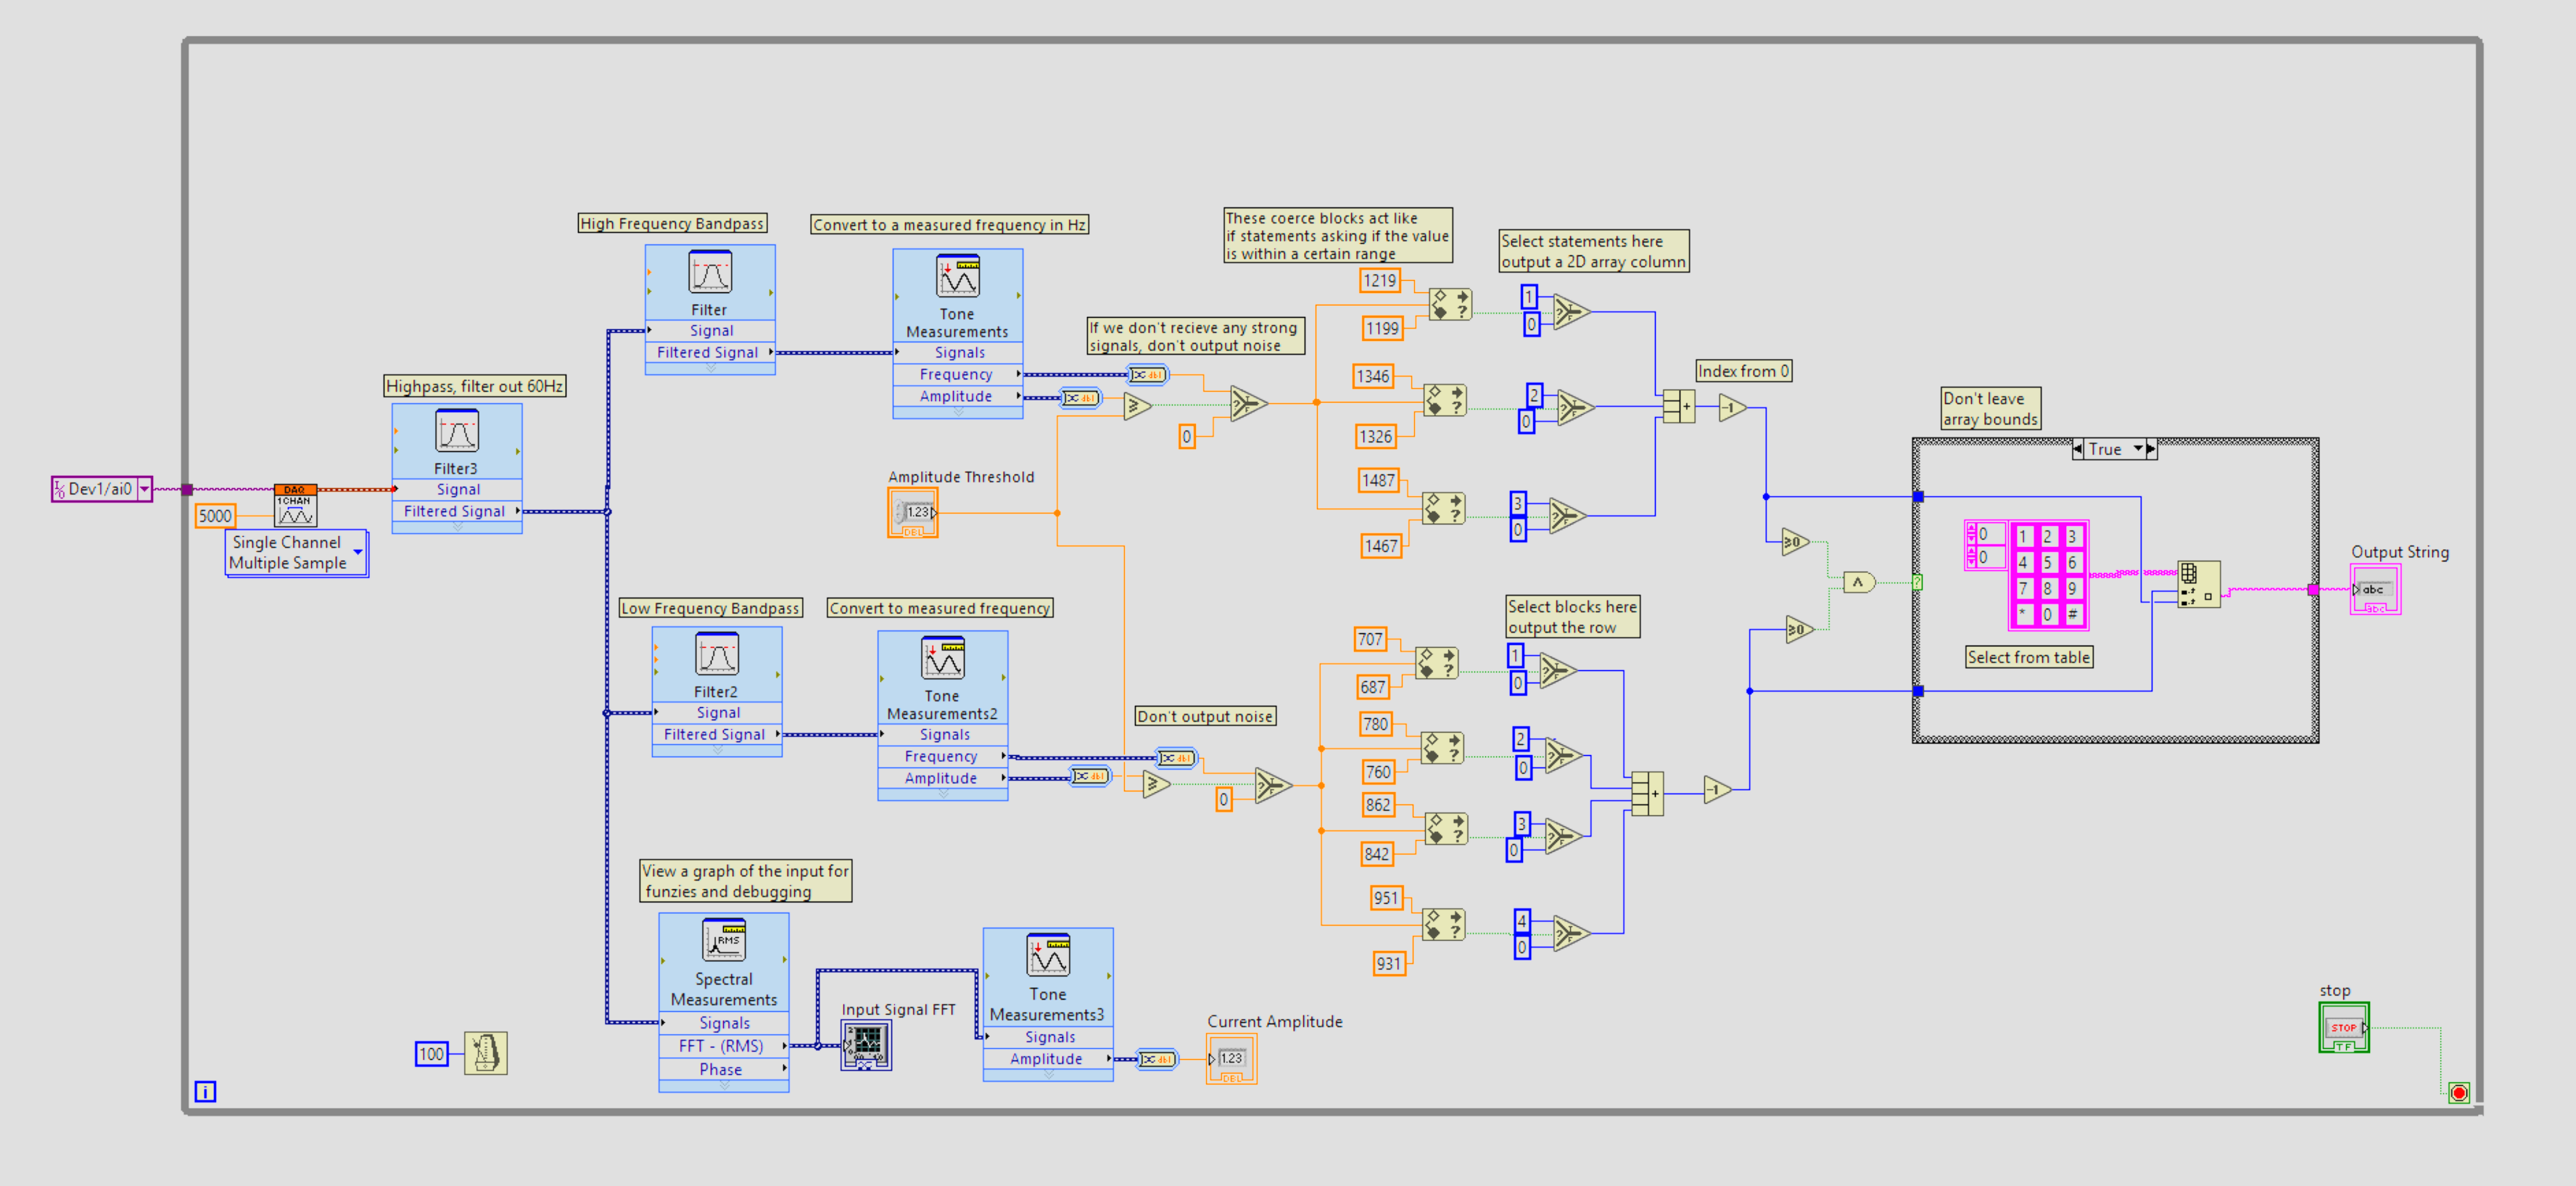
Signal Processing Pipeline:
- Acquisition: Continuous sampling at 5 kHz from DAQ.
- Filtering: A high-pass filter (200 Hz) removes 60 Hz mains noise, then the signal is split into high-frequency (1200-1700 Hz) and low-frequency (650-1000 Hz) bandpass filters.
- FFT Analysis: FFT converts each band to its frequency spectrum.
- Tone Detection: "In Range and Coerce" blocks identify the presence of specific DTMF frequencies with a ±10 Hz tolerance.
- Decoding Logic: The detected frequency pair is mapped to a 2D lookup array to determine the digit.
3.2.4 Performance & Applications
The decoder successfully demonstrated 100% accuracy for signals at nominal volume, with a measured Signal-to-Noise Ratio of 167:1 in lab conditions.
Beyond this project, the principles of frequency-domain analysis are directly applicable to other engineering fields, including:
- Seismology: Analyzing seismic wave frequencies to inform structural and civil engineering design.
- Vibration Analysis: Using FFTs for machinery fault detection by monitoring frequency signatures.
- Communications: Spectrum analysis, modulation, and demodulation.